Tag: evidence

Reality bites

Evidence-based practice is the darling of Learning & Development geeks.

And with good reason. Amongst all the myths and barrow pushing, not to mention the myriad ways to approach any given problem, empiricism injects a sorely needed dose of confidence into what we do.

Friends of my blog will already know that my undergraduate degree was in science, and although I graduated a thousand years ago, it forever equipped me with a lens through which I see the world. Suffice to say my search for statistical significance is serious.

But it is through this same lens that I also see the limitations of research. Hence I urge caution when using it to inform our decisions.

A scientist looking through a microscope.

For instance, I recently called out the “captive audience” that characterises many of the experiments undertaken in the educational domain. Subjects who are compelled to participate in these activities may not behave in the same manner as when they are not; which could, for example, complicate your informal learning strategy.

Hence studies undertaken in the K12 or higher education sectors may not translate so well in the corporate sector, where the dynamics of the environment are different. But even when a study is set among more authentic or relevant conditions, the results are unlikely to be universally representative. By design it locks down the variables, making it challenging to compare apples to apples.

In short, all organisations are different. They have different budgets, systems, policies, processes, and most consequentially, cultures. So if a study or even a meta-analysis demonstrates the efficacy of the flipped classroom approach to workplace training, it mightn’t replicate at your company because no one does the pre-work.

Essentially it’s a question of probability. Subscribing to the research theoretically shifts the odds of success in your favour, but it’s not a sure thing. You never know where along the normal distribution you’re gonna be.

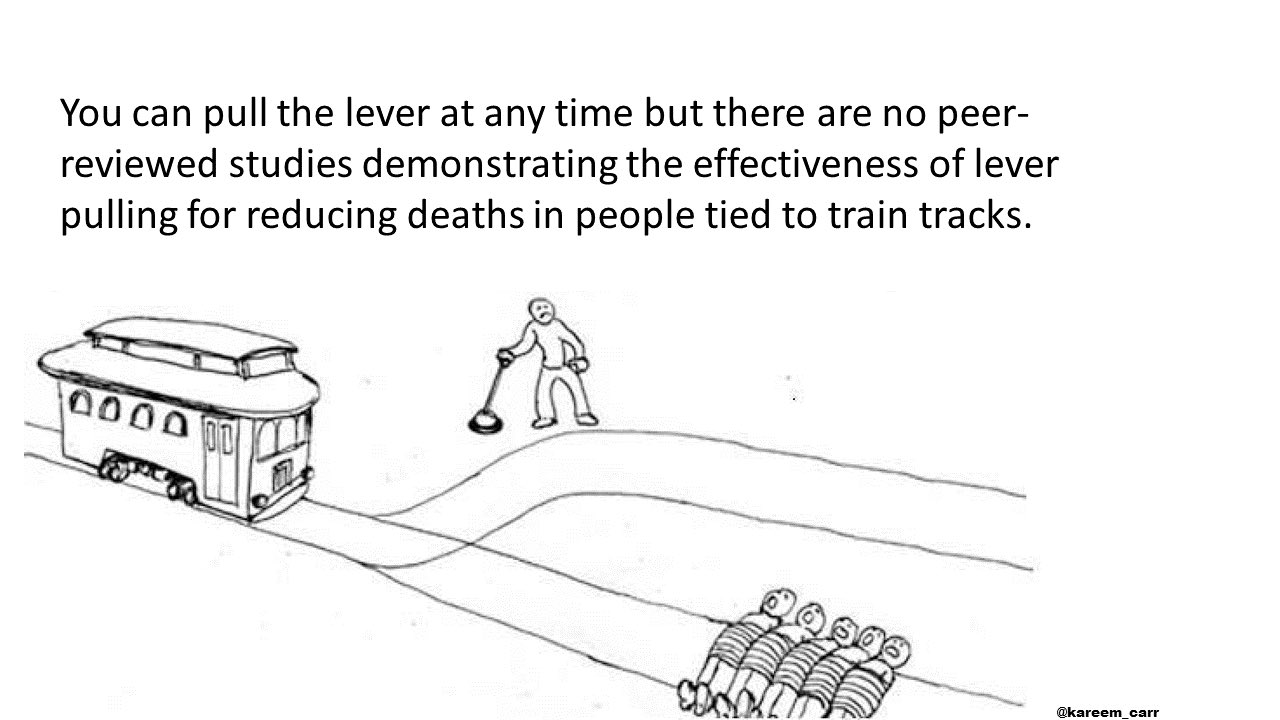
The Trolley Problem originally illustrated by Jesse Prinz and adapted by Kareem Carr.

My argument thus far has assumed that quality research exists. Yet despite the plethora of journals and books and reports and articles, we’ve all struggled to find coverage of that one specific topic. Perhaps it’s behind a paywall, or the experimental design is flawed, or the study simply hasn’t been done.

So while we may agree in principle that evidence-based practice is imperative, the reality of business dictates that in fact much of that evidence is lacking. In its absence, we have no choice but to rely on logic, experience, and sometimes gut instinct; informed by observation, conversation, and innovation.

In your capacity as an L&D professional, you need to run your own experiments within the construct of your own organisation. By all means take your cues from the available research, but do so with a critical mindset, and fill in the gaps with action.

Find out what works in your world.
Scaling up

In Roses are red, I proposed definitions for oft-used yet ambiguous terms such as “competency” and “capability”.

Not only did I suggest a competency be considered a task, but also that its measurement be binary: competent or not yet competent.

As a more general construct, a capability is not so readily measured in a binary fashion. For instance, the question is unlikely to be whether you can analyse data, but the degree to which you can do so. Hence capabilities are preferably measured via a proficiency scale.

Feet on scales

Of course numerous proficiency scales exist. For example:

No doubt each of these scales aligns to the purpose for which it was defined. So I wonder if a scale for the purpose of organisational development might align to the Kirkpatrick Model of Evaluation:

 Level  Label  Evidence 
0 Not Yet Assessed  None
1 Self Rater Self rated
2 Knower Passes an assessment
3 Doer Observed by others
4 Performer Meets relevant KPIs
5 Collaborator Teaches others

Table 1. Tracey Proficiency Scale (CC BY-NC-SA)

I contend that such a scale simplifies the measurement of proficiency for L&D professionals, and is presented in a language that is clear and self-evident for our target audience.

Hence it is ahem scalable across the organisation.

70:20:10 for trainers

Learning & Development Professional has been running a poll on the following question:

Is the 70:20:10 model still relevant today?

And I’m shocked by the results. At the time of writing this blog, over half the respondents have chosen “No”. Assuming they are all L&D professionals, the extrapolation means most of us don’t think the 70:20:10 model is relevant to our work.

But what does this really mean?

In LDP’s article The 70:20:10 model – how fair dinkum is it in 2015? – by the way, “fair dinkum” is Australian slang for “real” or “genuine” – Emeritus Professor David Boud says he doesn’t think there is proper evidence available for the effectiveness of the model.

If this is a backlash against the numbers, I urge us all to let it go already. Others have explained umpteen times that 70:20:10 is not a formula. It just refers to the general observation that the majority of learning in the workplace is done on the job, a substantial chunk is done by interacting with others, while a much smaller proportion is done off the job (eg in a classroom).

Indeed this observation doesn’t boast a wealth of empirical evidence to support it, although there is some – see here, here and here.

Nonetheless, I wonder if the hoo-ha is really about the evidence. After all, plenty of research can be cited to support the efficacy of on-the-job learning, social learning and formal training. To quibble over their relative proportions seems a bit pointless.

Consequently, some point the finger at trainers. These people are relics of a bygone era, clinging to the old paradigm because “that’s how we’ve always done it”. And while this might sound a bit harsh, it may contain a seed of truth. Change is hard, and no one wants their livelihood threatened.

If you feel deep down that you are one of the folks who views 70:20:10 as an “us vs them” proposition, I have two important messages that I wish to convey to you…

1. Training will never die.

While I believe the overall amount of formal training in the workplace will continue to decrease, it will never disappear altogether – principally for the reasons I’ve outlined in Let’s get rid of the instructors!.

Ergo, trainers will remain necessary for the foreseeable future.

2. The 70:20:10 model will improve your effectiveness.

As the forgetting curve illustrates, no matter how brilliant your workshops are, they are likely to be ineffective on their own.

Ebbinghaus Forgetting Curve showing exponentially decreasing retention over time

To overcome this problem, I suggest using the 70:20:10 model as a lens through which you view your instructional design.

For example, suppose you are charged with training the sales team on a new product. As a trainer, you will smash the “10” with an informative and engaging workshop filled with handouts, scenarios, role plays, activities etc.

Then your trainees return to their desks, put the handouts in a drawer, and try to remember all the important information for as long as humanly possible.

To help your audience remember, why not provide them with reference content in a central location, such as on the corporate intranet or in a wiki. Then they can look it up just in time when they need it; for example, in the waiting room while visiting a client.

Job aids would also be useful, especially for skills-based information; for example, the sequence of key messages to convey in a client conversation.

To improve the effectiveness of your workshop even further, consider doing the following:

  • Engage each trainee’s manager to act as their coach or mentor. Not only does this extend the learning experience, but it also bakes in accountability for the learning.
  • Encourage the manager to engineer opportunities for the trainee to put their learning into practice. These can form part of the assessment.
  • Set up a community of practice forum in which the trainee can ask questions in the moment. This fosters collaboration among the team and reduces the burden on the L&D department to respond to each and every request.
  • Partner each trainee with a buddy to accompany them on their sales calls. The buddy can act as a role model and provide feedback to the trainee.

In my humble opinion, it is counter-productive to rail against 70:20:10.

As an L&D professional, it is in your interest to embrace it.

Facts are a bitch

This morning I posted the following question to Twitter:

What do you think of Parrashoot as the name of a local photography competition in Parramatta?

The word play is genius, no?

A man using a camera.

Now, for those of you who don’t know, Parramatta is the cosmopolitan sister city of Sydney, approximately 23 kilometres (14 miles) west of the Harbour Bridge.

Due to its geographical location and its colourful history, it is often put down by yuppies and wanna-be’s, and is typically lumped into the broad, vague and lazy category “Sydney’s West” which features prominently on the nightly news.

While this view of my local area is about 25 years out of date (and perhaps a little racist?) it doesn’t seem to affect its prevalence.

Anyway, among the replies I received to my tweet was one that linked the fragment “shoot” to homicide. It’s clear the guy was joking, but it got me thinking…

Being the geek I am, I looked up the state’s crime statistics and graphed the homicides recorded by the police from 1995 through to 2009:

Graph of homicides recorded by NSW Police from 1995 through to 2009.

The results are intriguing – not only because the figures are incredibly low for a major metropolis.

Notice how Inner Sydney (the CBD and surrounds) tops the list with 156 reports, followed by Fairfield-Liverpool (southwestern suburbs), then the Hunter (northern wine & coal region), Canterbury-Bankstown (inner southwestern suburbs), Illawarra (south coast) and the Mid North Coast.

Eventually Central West Sydney (which includes Parramatta) makes an appearance with 66 reports, while – hang on! – the well-heeled Eastern Suburbs rounds out the Top 10 with 52 reports.

Oh, my. That’s enough to make oneself gag on one’s latte.

So what’s this got to do with learning?

In the workplace, how often do we L&D professionals make assumptions that simply aren’t true?

I’ll hazard a guess: too often.

My point is, we should endeavour to back up our assumptions with evidence.

  • What are the learning priorities of the business?
  • What is the most effective mode of delivery?
  • Is Gen-Y collaborative?
  • Are baby boomers technophobic?
  • Does that expensive leadership course improve performance?
  • Are our people incapable of self-directed learning?

These are just some of the many questions that we really should answer with data.

Otherwise we may find ourselves about 25 years out of date.